We’ve introduced five updates to make managing irrigation and scheduling fertigation easier with Semios:
- See flow meter volumes in your weekly Semios report
- See pressure transducer readings from the map view
- Devices from other vendors are now clearly labeled with the vendor’s logo
- Choose to show water events in your soil moisture chart from just the probe location or the whole irrigation zone
- Schedule fertigation events by volume or proportion
We’ll dive into more details for each of these updates below:
See flow meter volumes in your weekly report
The weekly general report now includes a Flow Meters table under Irrigation Activity, in both the email and the PDF. Each row is a flow meter and each column shows its daily water volume for the last seven days.
Volumes use your chosen unit (gal, cf, af, m³ or ML), so you can review a week of water use straight from your inbox. The table appears for properties with irrigation zones, for report owners with permission to view flow meter details.
See pressure transducer readings from the Irrigation Activity map view
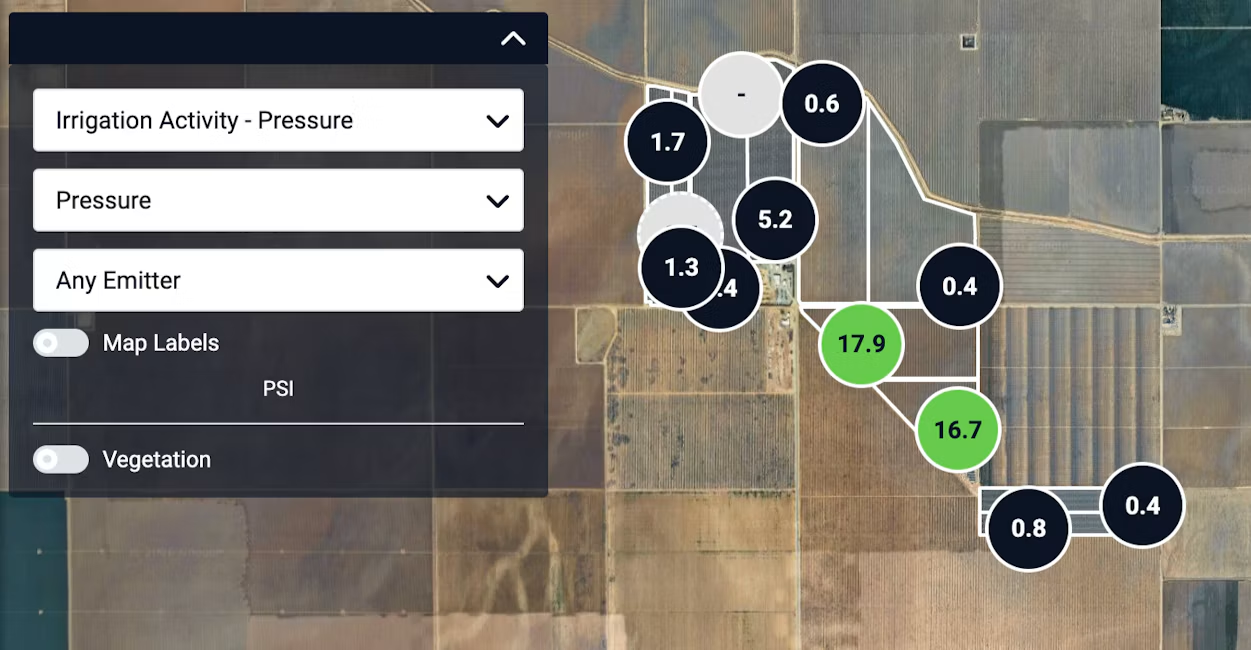
Customers with pressure transducers (PTs) can now view the latest pressure readings right from the map view. Readings will be displayed in either PSI or kPa, based on your unit settings, and their colors indicate the current status:
- Green means the line is running
- Black means the line is off
- Grey means the status is unknown
This update makes it easier to get a quick view of pressure across your property or organization, so you can catch issues early and confirm your irrigation is running as it should.
Tell your devices apart at a glance
Previously, devices from other vendors, such as Wiseconn, looked the same as Semios devices in our app. Now third party devices show a vendor badge next to their name, and zones show a badge for the system that controls them.
You’ll see badges wherever you pick or review devices, including:
- Summary tables and Graphs dropdowns
- Water dashboards and map cards
- The irrigation scheduler
- Alert and Data Export pickers
Choose which water events your soil moisture chart shows
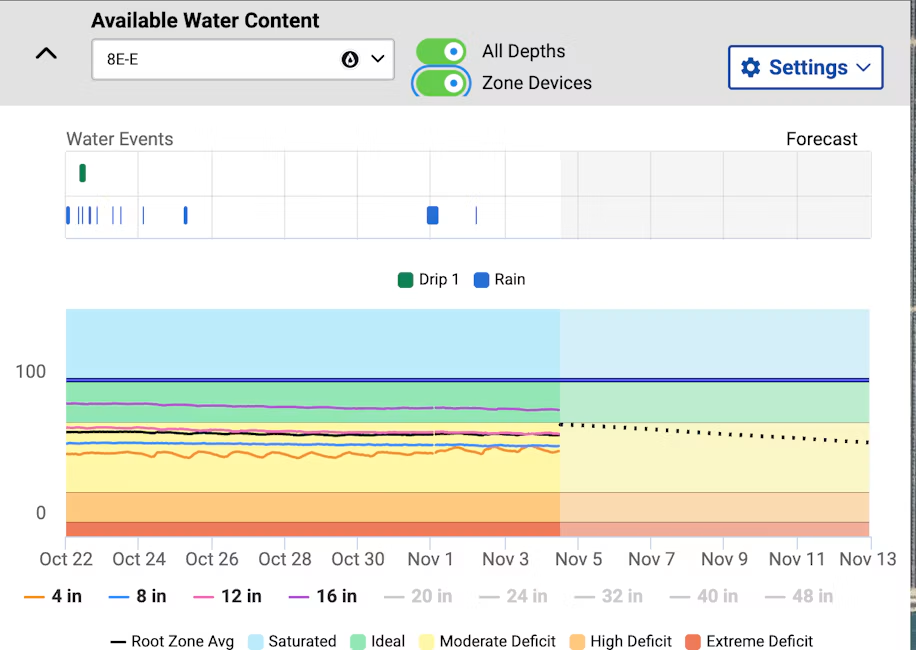
The Water Events strip above the Available Water Content graph shows rain, irrigation picked up by pressure transducers (PTs), and scheduled irrigation.
A new Zone Devices switch gives you greater control over what it shows. With the switch off, the strip only shows water events reported by the PT at the selected soil moisture probe’s location. With the switch on, it shows water events reported by every irrigation device in the probe’s zone. The legend and scheduled irrigation follow your choice, and the Semios app will automatically apply your Zone Devices switch setting across all your probes.
Schedule fertigation by volume or proportion
Fertigation in the irrigation scheduler could previously only be set by duration. Now you can choose from three fertigation types: Duration (still the default), Volume or Proportional.
With Volume, enter the fertilizer volume and it calculates the estimated duration, flush duration and end time from the tank’s flow rate. With Proportional, enter a duration, water volume and fertilizer volume, and the app shows the ratio per 1,000. If a fertigation won’t fit within the irrigation event, the irrigation scheduler will prompt you to adjust the volume or start delay.
A clearer picture of water across your operation
Whether you’re reviewing last week’s water use, checking which system controls a zone or planning your next fertigation, these updates put the information you need where you already work.
All five updates are available in our app now. Learn more in our Help Center or contact your Customer Success representative.