Managing irrigation effectively means keeping track of a lot of information. Irrigation activity, soil moisture, flow rates, pressure, rainfall and evapotranspiration all contribute to understanding what’s happening across an operation. Until now, reviewing that information in Hub often meant moving between individual properties, data types and different views to build the full picture.
We’ve introduced two new Water Dashboards in Hub: Water Usage and Water Monitoring, designed to bring this information together and make it easier to understand water use and conditions across your operation.
With the new dashboards, you can select multiple properties, compare water use with soil conditions, and quickly identify where irrigation may need attention.
Water Usage: understand where and how water is being applied
The new Water Usage dashboard provides a centralized view of irrigation activity across your selected properties.
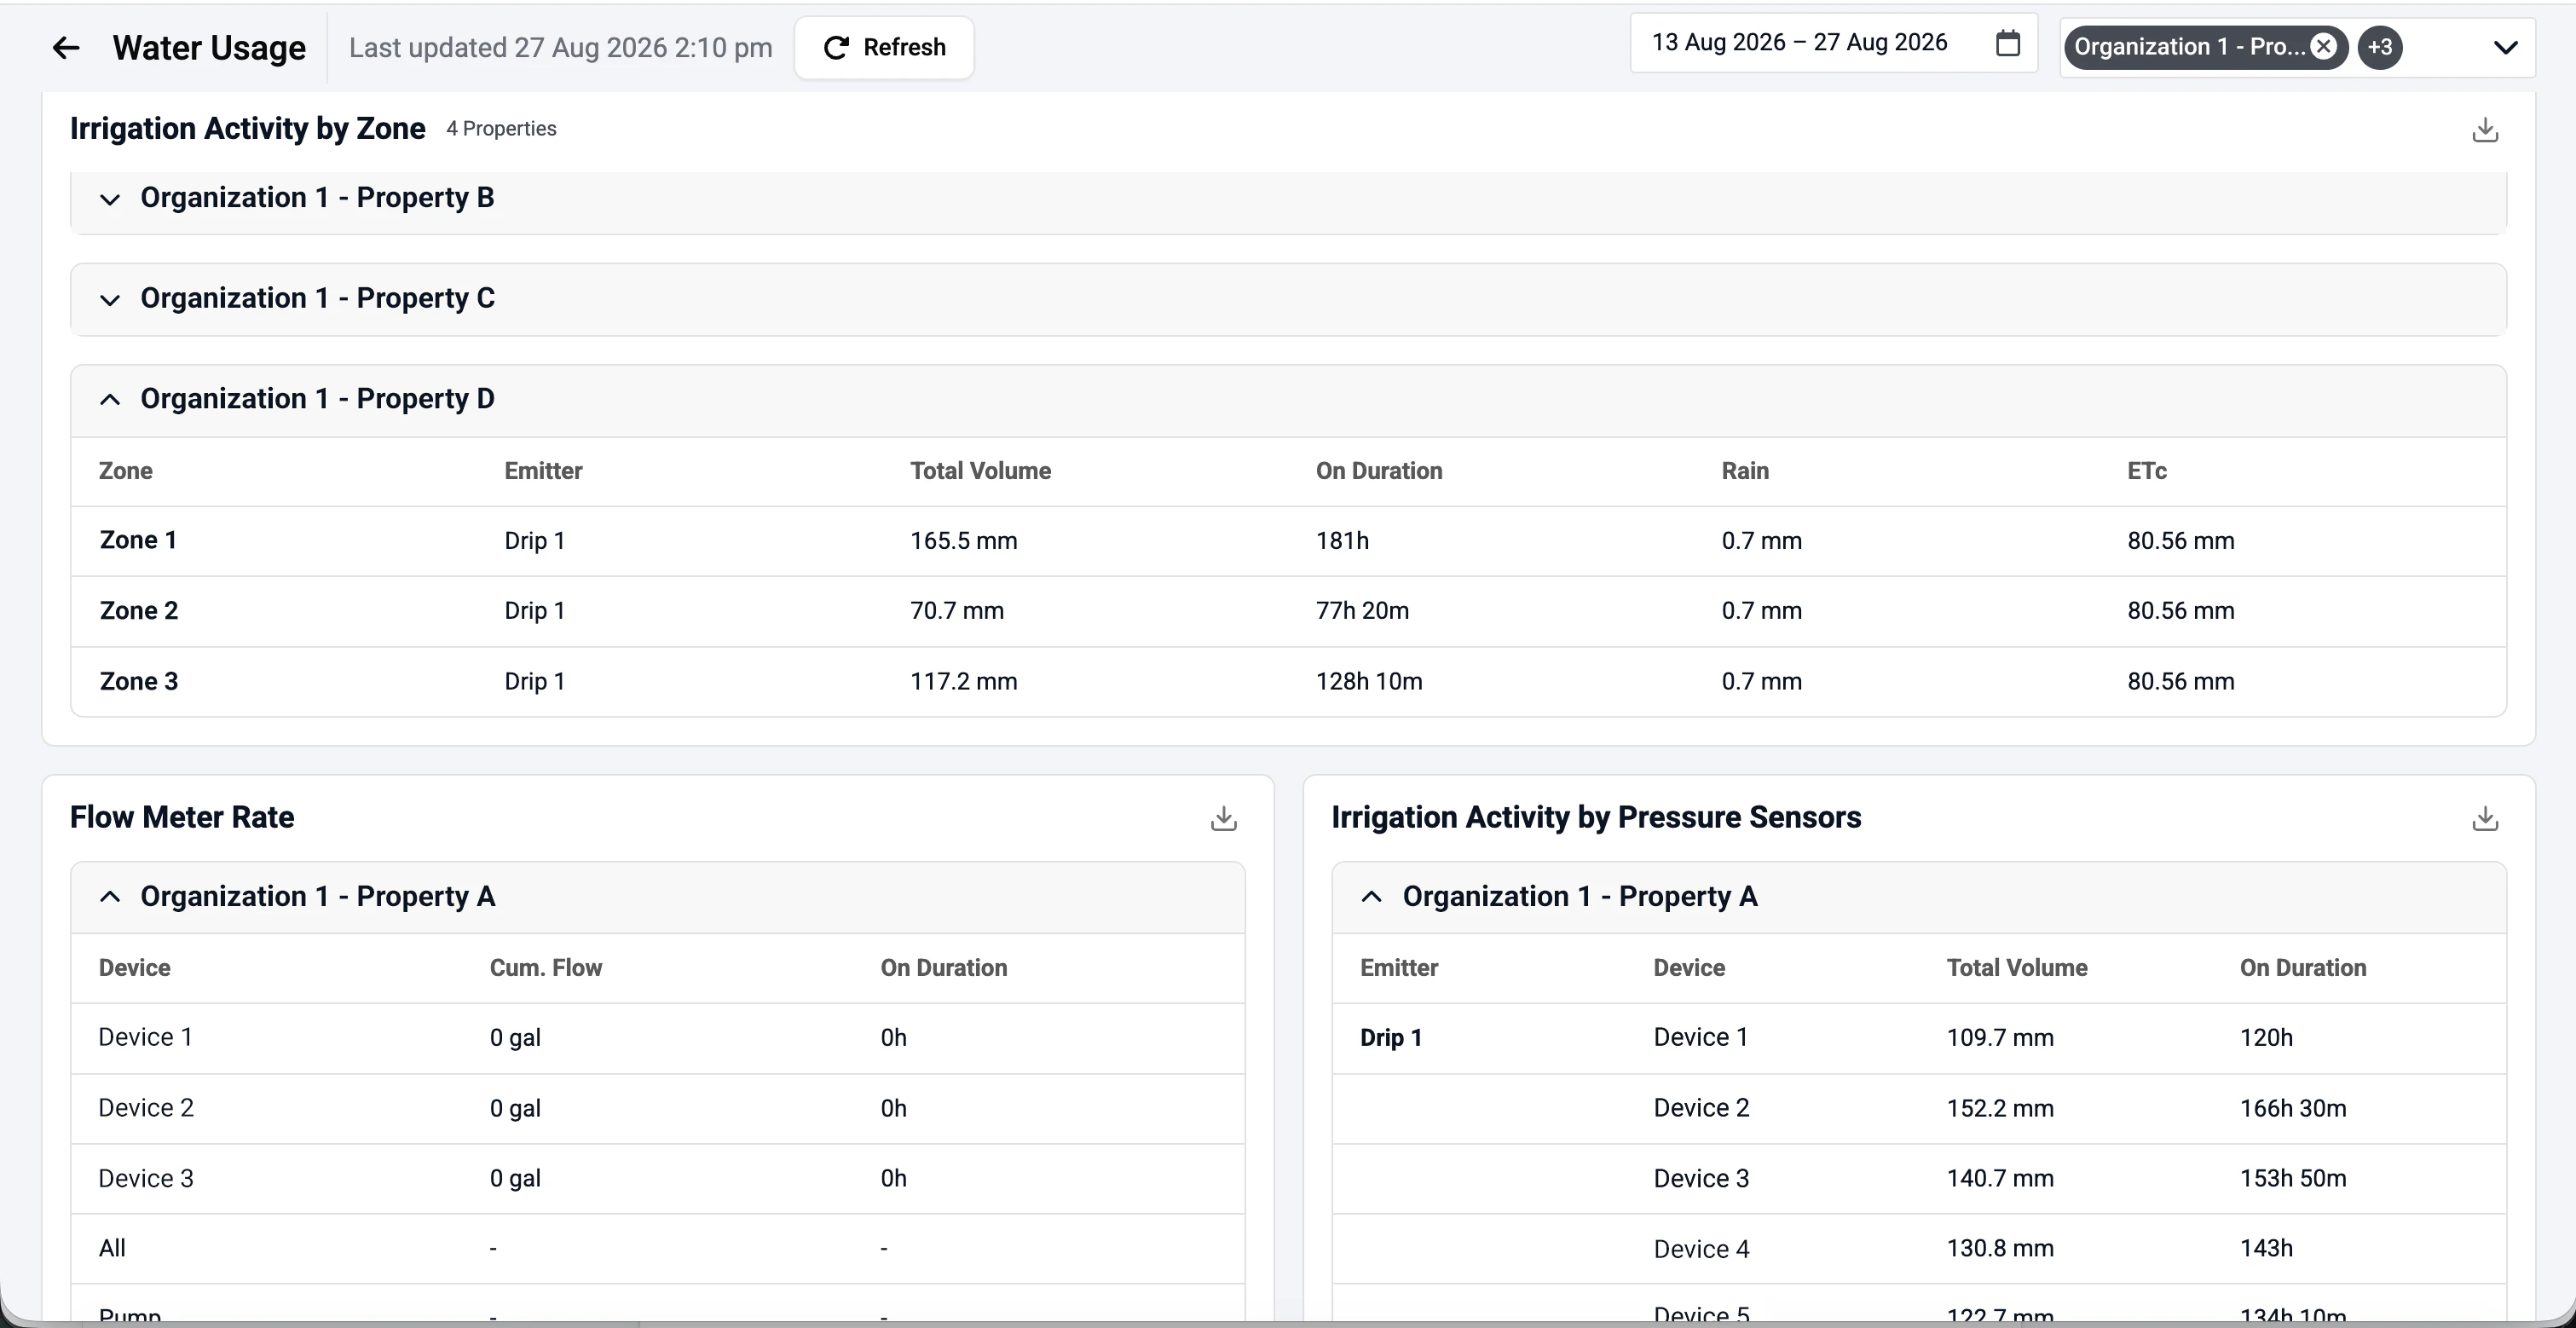
Choose the date range you want to review and see key metrics including:
- Irrigation activity by zone
- Flow meter rates
- Pressure sensor data
- Irrigation duration
Rather than moving between properties or viewing each data source separately, you can bring this information together to get a clearer picture of how much water was applied, where it was applied, and for how long.
Information is organized into collapsible sections, with those that don’t contain data collapsed by default to keep the dashboard focused on what’s relevant.
Water Monitoring: see what’s happening below the surface
The Water Monitoring dashboard brings soil moisture and water balance information together at a zone level, helping you understand current conditions and how they are changing.
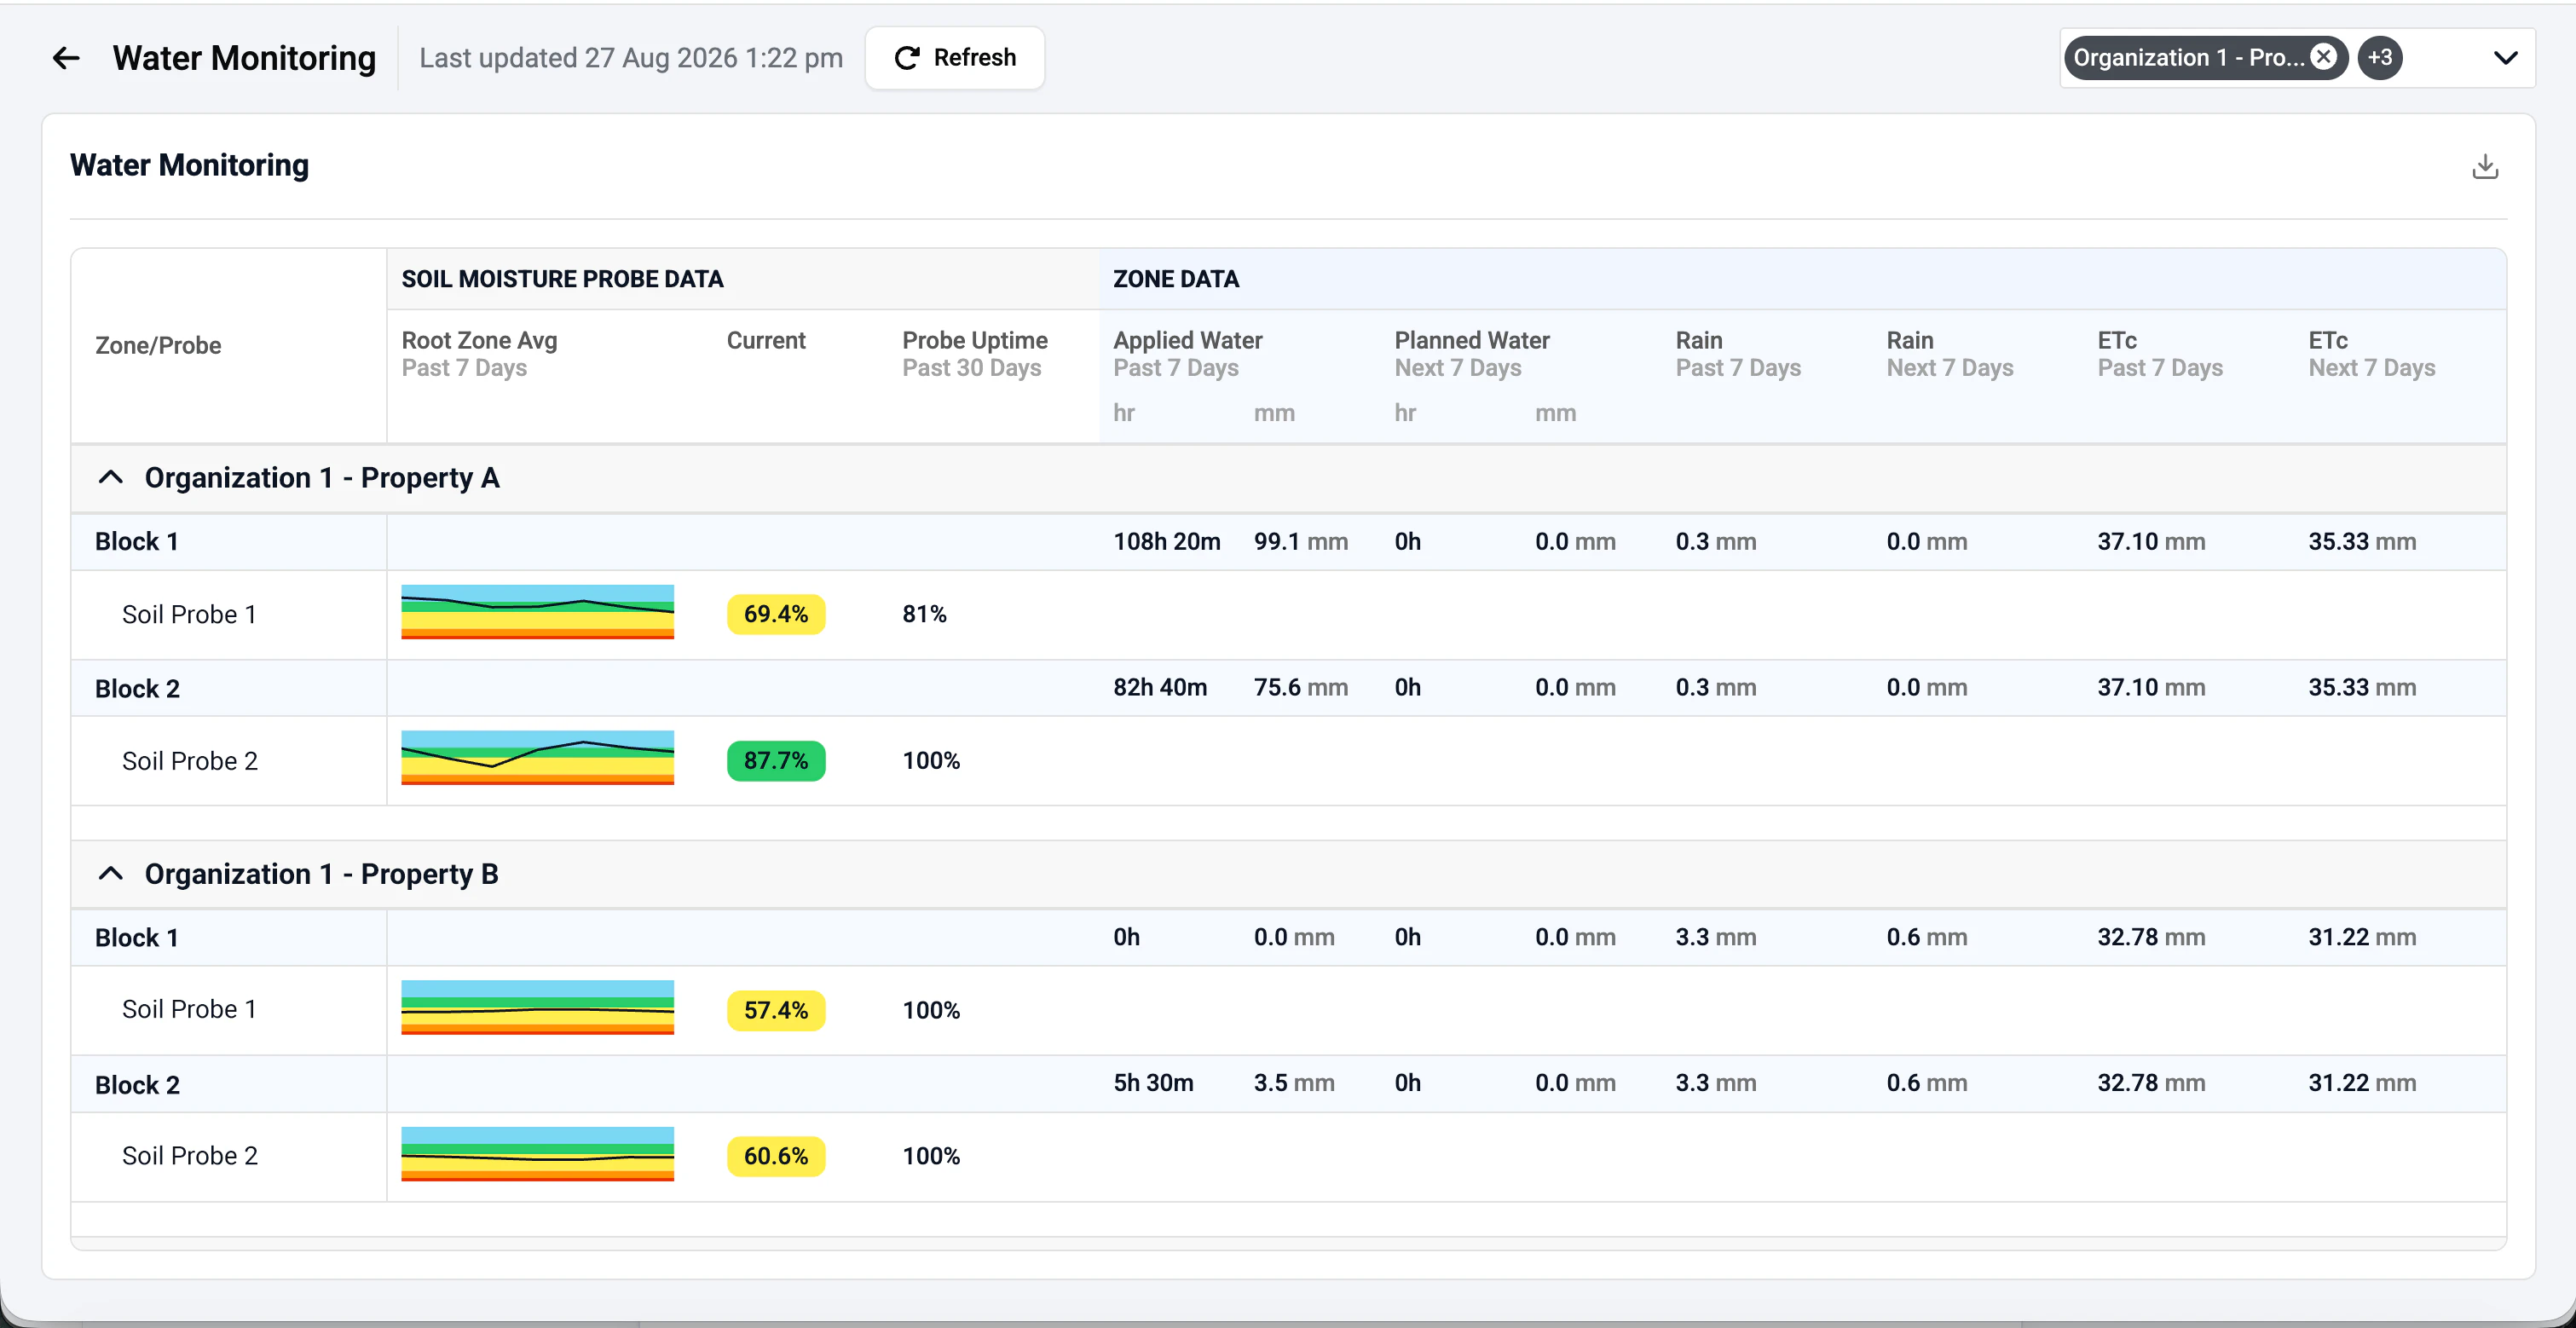
From one dashboard, you can review:
- Soil moisture trends
- Current soil moisture readings
- Water deficits
- Applied versus planned water
- Rainfall
- Crop evapotranspiration (ETc)
- Historical and forecast weather data
Small trend charts provide a quick view of how soil conditions have been changing, while detailed chart views let you explore information such as irrigation deficits and saturation levels more closely.
This makes it easier to move from simply viewing individual sensor readings to understanding the broader water picture for each zone.
Quickly check whether your probes are reporting
We’ve introduced Probe Uptime, a new metric that shows the percentage of hours a soil moisture probe reported data over the previous 30 days.
This gives you a quick way to understand whether a probe has been consistently reporting before using its readings to inform decisions.
Keep in mind that newly installed probes may initially show lower uptime because the calculation covers the full previous 30-day period, including the time before the probe was installed.
View multiple properties in one place
For operations managing more than one property, the new dashboards make it easier to see what’s happening across the operation without repeatedly switching between individual properties.
You can select multiple properties at once, with information clearly separated into property-specific sections. This provides a broader view of the operation while still making it easy to understand what’s happening at each property.
Access to information continues to follow your existing irrigation and soil moisture permissions for each property.
Export and explore your data
The new dashboards also give you more flexibility when you need to take a closer look at your information or use it elsewhere.
You can:
- Select custom date ranges
- Refresh dashboard data on demand
- Export data as CSV files
- Download chart images
- Open charts in a larger view for additional detail
Together, these tools make it easier to review, share and work with your water data without needing to piece information together from multiple areas of Hub.
A clearer view of water across your operation
The new Water Dashboards are designed to make water data easier to access and understand by bringing information that was previously spread across different properties and views into one place.
Whether you’re reviewing how much water has been applied, checking soil moisture conditions, checking whether equipment is reporting consistently or deciding where attention is needed next, Water Usage and Water Monitoring give you a more complete view of what’s happening across your operation.
The new Water Usage and Water Monitoring dashboards are available now in Hub under Dashboards. You can learn how to use them here.